Predicting next-day “heat” for stocks from r/WallStreetBets
This project combines Reddit’s r/WallStreetBets discussion data with historical US stock prices to predict which tickers are most likely to experience large next-day moves, and ranks them with a learned heat score. Dataset: 16,645 ticker-days across 78 tickers (2023-06-08 → 2025-03-31), big-move base rate = 10.9%. The final model blends WSB mention volume, sentiment scores, engagement signals, and lagged price/volatility features; baselines include popularity-only rankings and logistic regression on simple tabular features.
1. Predictive Task & Evaluation Plan
Predict large next-day moves for each ticker-day using WSB chatter + price/volume history, then rank tickers by a heat score.
Overview. We start with a time-series view for NVDA plotting price index and daily WSB attention (mentions, scores, unique authors), highlighting high-attention days and large next-day absolute returns. Hype days often coincide with volatility, but not every spike is followed by a big move.
1.1 Predictive task
Task. For each (ticker, day), predict whether the ticker will make a large next-day move and assign a heat score (probability of a big move).
- Label:
big_move = 1if|next_return| ≥ 5%; else0. - Inputs (per ticker-day):
- WSB activity: mention counts, upvote score sums, unique authors, post/comment mix.
- Text: aggregated WSB posts/comments represented with TF-IDF (1-2 grams).
- Sentiment: VADER scores aggregated per ticker-day.
- Price/volume history: return, log-volume, recent return windows (1d/3d/5d), rolling volatility, volume anomalies.
- Output:
P(big_move = 1 | features)— a continuous heat score in [0,1] used for classification or ranking.
1.2 Evaluation setup
- Train / val / test split: oldest ~70% train, next ~15% val, most recent ~15% test (date-based, no shuffling).
- Model family: logistic regression pipelines (course-relevant) combining TF-IDF text + standardized numeric features.
- Hyperparameters & threshold: tuned with
TimeSeriesSpliton train+val; decision threshold picked on a held-out slice for F1; test set used once. - Metrics: primary F1; also precision, recall, ROC-AUC, accuracy for context; ROC curves judge heat-score ranking.
1.3 Baselines
- Trivial: always 0, always 1.
- Numeric logistic: price-only; WSB-only numeric; price + WSB numeric.
- Text baselines: TF-IDF text-only; TF-IDF text + basic numeric (return, log_volume, mention_count, score_sum).
- Final model: TF-IDF text + all numeric (price/volume history, volatility, volume anomalies, WSB activity, sentiment) with tuned hyperparameters/threshold.
1.4 Validity / sanity checks
- No look-ahead: targets use next-day returns; features use same-day or lagged signals; chronological splits prevent leakage.
- Robustness: confusion matrices and ROC curves compare price-only vs final; slice by ticker/time (e.g., NVDA) to see when heat aligns with true big moves.
2. Exploratory Analysis, Data Collection & Pre-processing
Reddit WSB posts/comments and Yahoo Finance prices are aligned into a daily (ticker, day) table used for EDA and all downstream models.
2.1 Data sources (context)
- Reddit (r/WallStreetBets): CSV of posts/comments with text, author, timestamp, score, and tags.
- Yahoo Finance: Daily OHLCV prices for a curated set of WSB tickers over 2023–2025.
Goal: align these into a daily (ticker, day) table that feeds both EDA and the prediction task.
Example raw WSB rows (truncated)
| register_index | post_id | comment_id | author | datetime | title | url | score | comments | text | author_post_karma | tag |
|---|---|---|---|---|---|---|---|---|---|---|---|
| 14b78hkjoe86nf | 14b78hk | joe86nf | scott_jr | 2023-06-16 20:36:55 | 1.0 | Watch til 1 10 | 32102.0 | Meme | |||
| 14b71m2post | 14b71m2 | merakibret | 2023-06-16 20:24:01 | I had my first ever big success with options t... | https://www.reddit.com/r/wallstreetbets/commen... | 8.0 | 6.0 | Entered an Iron Condor on ADBE yesterday at 45... | 343.0 | Gain | |
| 14b71m2joe6du9 | 14b71m2 | joe6du9 | VisualMod | 2023-06-16 20:24:07 | 1.0 | User Report Tota... | 725083.0 | Gain | |||
| 14b71m2joe6een | 14b71m2 | joe6een | VisualMod | 2023-06-16 20:24:13 | 2.0 | That was a very wise move | 725083.0 | Gain | |||
| 14b71m2joe7yy4 | 14b71m2 | joe7yy4 | DreamcatcherEgg | 2023-06-16 20:35:23 | 2.0 | All you have to do is repeat this same winning... | 6088.0 | Gain |
2.2 Cleaning and ticker construction
- Normalize
datetimeto dates; drop bots/mods and[deleted]/[removed]rows. - Build
raw_textfromtitle+text, thenclean_textby stripping URLs, collapsing whitespace, lowercasing. - Extract candidate tickers via cashtags (
$TSLA) and uppercase tokens (TSLA,NVDA); keep tokens with ≥500 mentions; filter obvious non-stocks; require valid Yahoo price history. - Explode to one row per (WSB row, ticker):
wsb_exploded.
2.3 Price alignment and feature table
Sample Yahoo Finance price rows (long format)
| datetime | ticker | adj_close | close | high | low | open | volume |
|---|---|---|---|---|---|---|---|
| 6/1/23 | AAPL | 177.93 | 180.09 | 180.12 | 176.93 | 177.70 | 68901800 |
| 6/2/23 | AAPL | 178.78 | 180.95 | 181.78 | 179.26 | 181.03 | 61996900 |
| 6/5/23 | AAPL | 177.43 | 179.58 | 184.95 | 178.04 | 182.63 | 121946500 |
| 6/6/23 | AAPL | 177.06 | 179.21 | 180.12 | 177.43 | 179.97 | 64848400 |
| 6/7/23 | AAPL | 175.69 | 177.82 | 181.21 | 177.32 | 178.44 | 61944600 |
- From Yahoo prices: compute daily
return,next_return, andbig_move = 1[|next_return| ≥ 5%]; keep(datetime, ticker, close, volume, return, next_return, big_move). - Aggregate WSB to (datetime, ticker):
- Numeric:
mention_count,score_sum,score_mean,post_fraction,unique_authors. - Text: concatenate
clean_text→doc_text.
- Numeric:
- Merge price + WSB numeric + text, add
log_volume = log(1 + volume), drop rows with missing core features. Final modeling table: ~16k daily examples.
2.4 Key EDA findings (with plots)
- Return distribution: fat-tailed around 0; 5% sits in the tail → reasonable “big move” cutoff.
- WSB attention vs volatility: higher mention buckets have larger mean
|next-day return|→ attention aligns with higher volatility. - Text content: word cloud dominated by tickers, options slang, and event words → confirms domain relevance.
- Ticker case studies (NVDA, TSLA): indexed price + high-attention marks + big-move bars show large moves often coincide with elevated WSB activity, motivating a probabilistic model.
2.5 Inputs to the model (summary)
- Inputs: WSB numeric features, price/volume + lags/volatility, VADER sentiment, and
doc_text(for TF-IDF). - Label:
big_move ∈ {0,1}for ≥5% absolute next-day moves.
Takeaway: Returns are centered near 0 with fat tails; the 5% VaR bands capture the big-move threshold used for labels, underscoring the class imbalance of rare ±5% days.
Takeaway: Modest positive drift early in the week and weaker performance on Thursdays; day-of-week is a minor effect compared to WSB attention spikes.
Takeaway: Higher mention buckets correlate with larger absolute next-day returns (volatility lift), motivating the inclusion of WSB volume features.
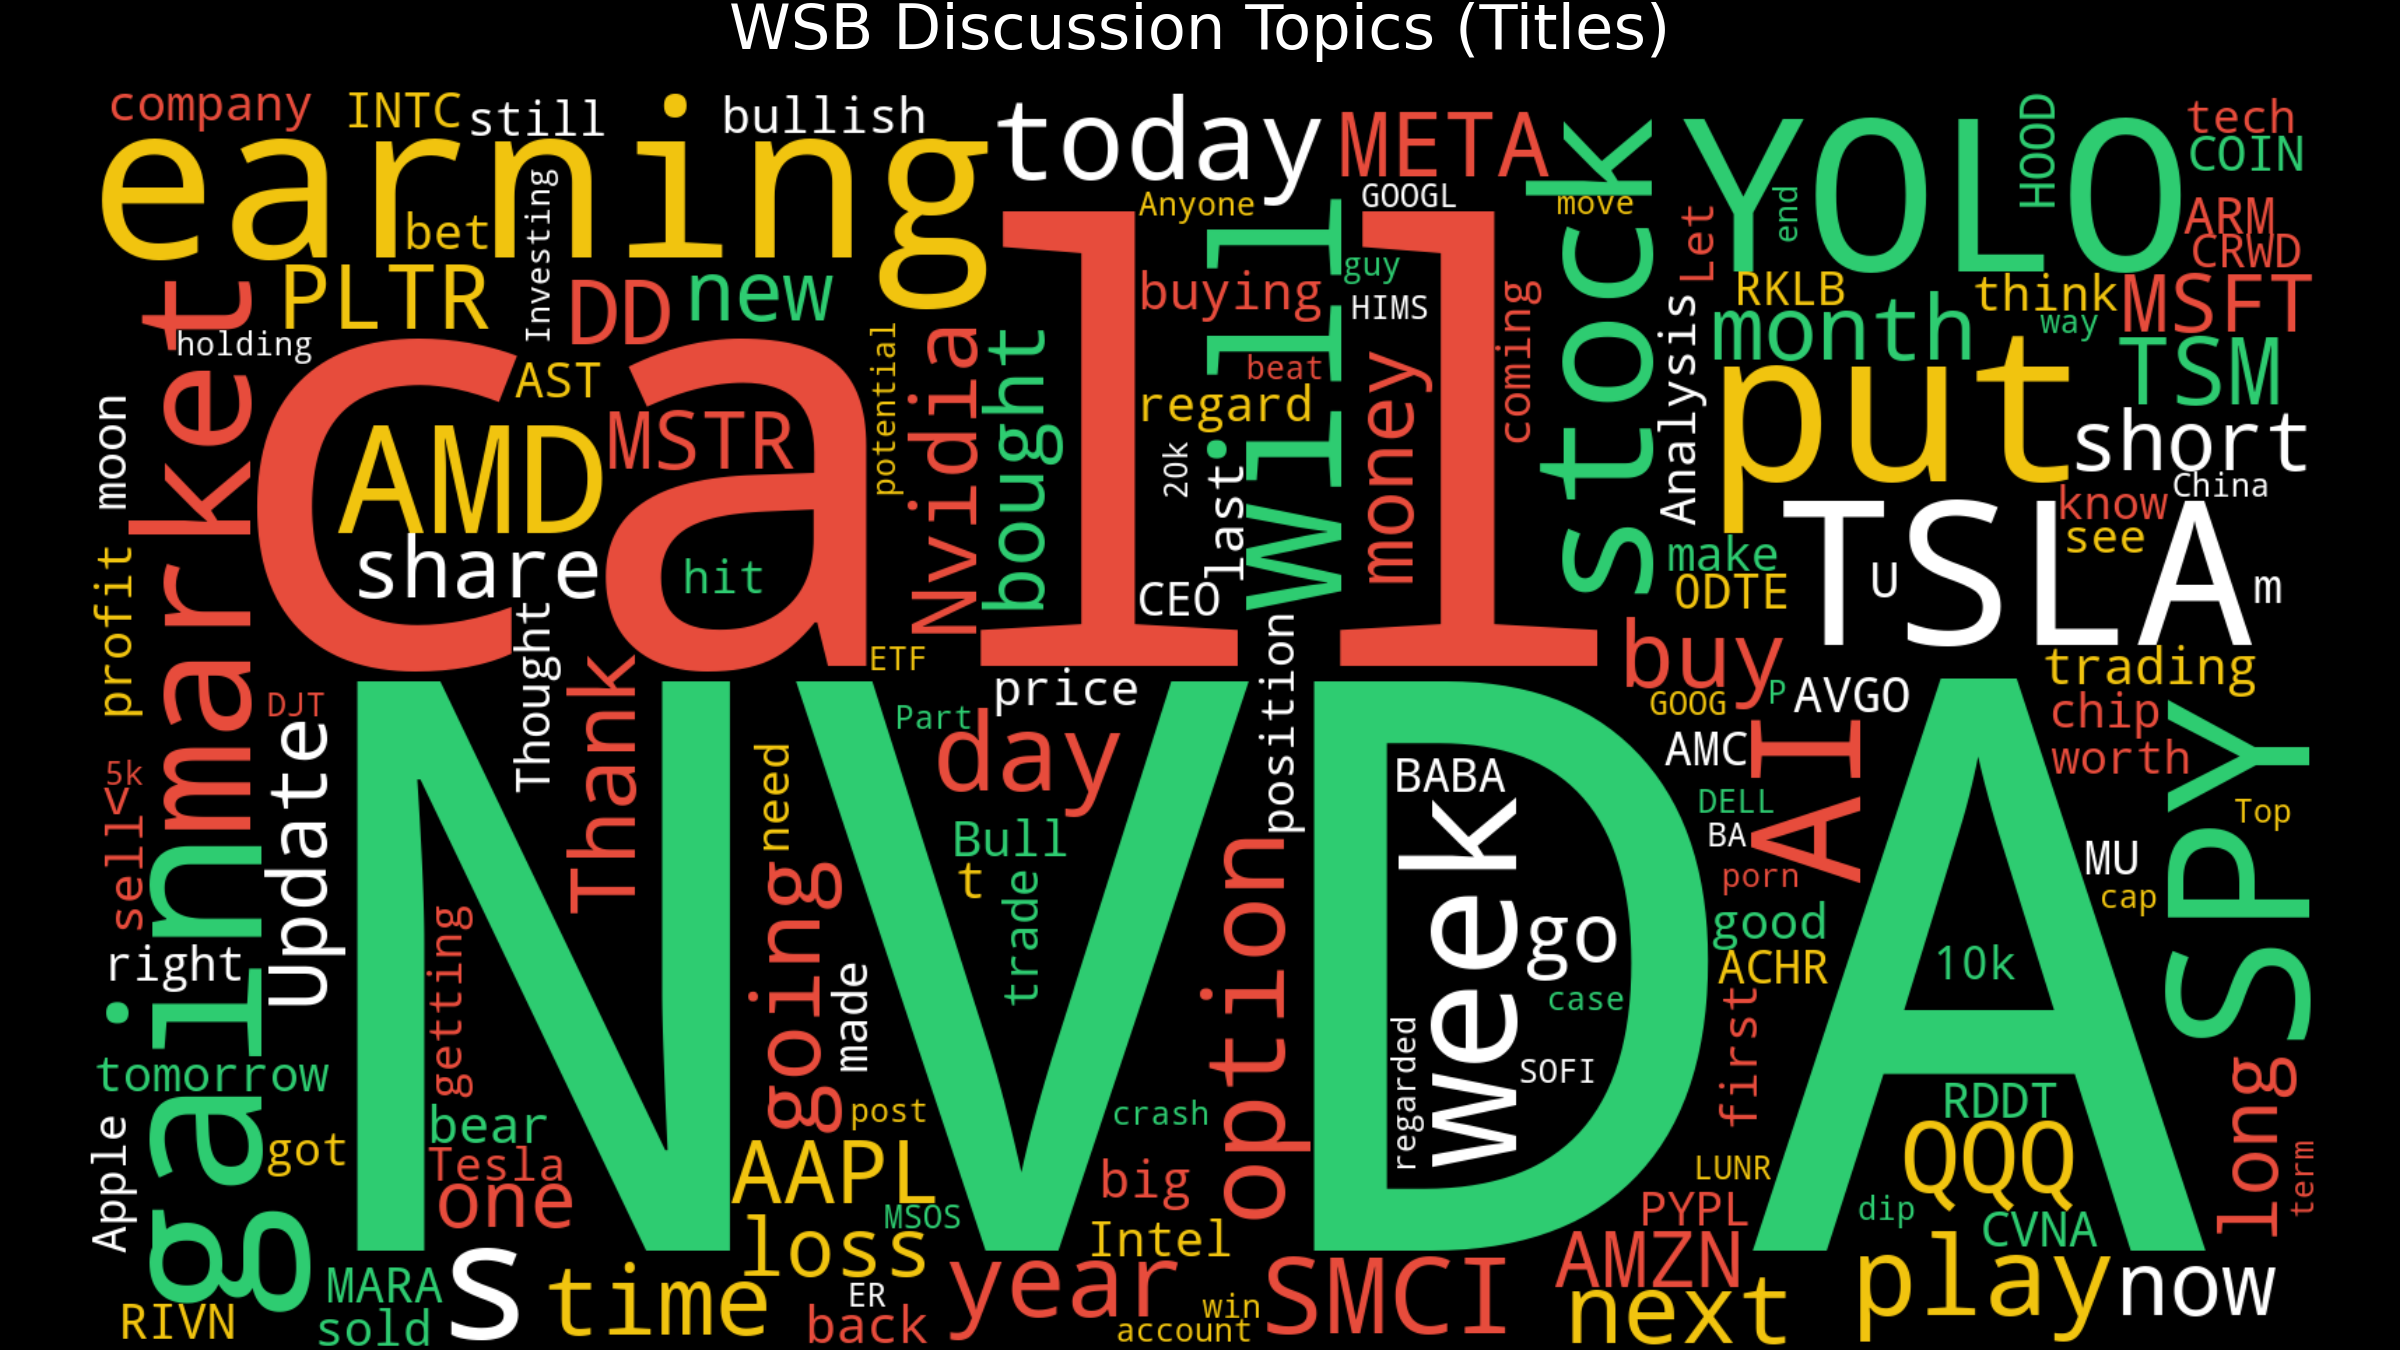
Takeaway: Dominant tokens are ticker symbols, options slang, and catalyst language (earnings, calls/puts), which the TF-IDF text features capture.
3. Modeling
Binary classification at the (ticker, day) level; the predicted probability is used as a heat score to rank tickers by risk of a large move.
3.1 Task formulation
- Unit: one row = one (ticker, date).
- Label:
big_move = 1if|next_return| ≥ 5%(next-day close-to-close); else0. - Output:
\u005Chat{p} = P(big_move = 1 | x), the heat score; higher = more likely ≥5% absolute move tomorrow.
3.2 Features
- Price & volume (short-term dynamics): return, log_volume; lags
ret_prev_1d/3d/5d; volatilityvol_5d/vol_10d; volume anomalyvol_rel_5d. - WSB numeric signals: mention_count, score_sum, score_mean, post_fraction, unique_authors.
- Sentiment: VADER sent_mean per ticker-day.
- Textual signal: doc_text (all WSB text per ticker-day) → TF-IDF (1–2 grams, capped vocab).
3.3 Baseline models (all logistic regression)
- Price-only logistic — features
['return', 'log_volume'], scaled. - WSB-numeric-only logistic — features
['mention_count', 'score_sum']. - Price + WSB numeric logistic —
['return', 'log_volume', 'mention_count', 'score_sum']. - Text-only logistic — TF-IDF on doc_text (max_features 10k, ngram_range (1,2)).
- Text + basic numeric logistic — TF-IDF + scaled
[return, log_volume, mention_count, score_sum](sparse + dense hstack).
Each numeric baseline uses:
pipe = Pipeline([
    ("scaler", StandardScaler()),
    ("clf", LogisticRegression(
        penalty="l2",
        C=1.0,
        class_weight="balanced",
        max_iter=1000,
        solver="lbfgs",
    )),
])
pipe.fit(X_train, y_train)
3.4 Final model and tuning
- Inputs: doc_text + all numeric columns (price/volume history, volatility, volume anomalies, WSB activity, sentiment).
- Architecture:
ColumnTransformerwith TF-IDF branch + scaled numeric branch →LogisticRegression(max_iter=1000). - CV: train+val combined, chronological;
TimeSeriesSplit(n_splits=5). - Grid search: TF-IDF
max_features ∈ {5000,10000},ngram_range ∈ {(1,1),(1,2)},min_df=5,max_df=0.7; LogisticC ∈ {0.1,1.0,10.0},class_weight ∈ {'balanced', None}. Maximize F1; freeze best pipeline and evaluate once on test.
3.5 Advantages and limitations
- Pros: aligned with course content; fast on ~16k examples; produces probability heat scores for ranking; handles sparse TF-IDF + dense numeric.
- Handling imbalance/dynamics: class weights; lagged returns/volatility/volume anomalies; attention signals (mentions/authors/sentiment).
- Limits: linear boundary, no explicit text–price interactions, no temporal sequence model.
4. Evaluation
Metrics, baselines, and diagnostic plots that justify the final model choice.
4.1 Protocol
- Split: Time-based 70% train / 15% val / 15% test (no shuffling).
- Outputs: Model returns
P(big_move=1)= heat score. - Threshold: One decision threshold picked on validation F1, then fixed; test is used once.
- Metrics (test): main = F1 (positives ≈ 10–12%); also precision, recall, ROC-AUC, accuracy; diagnostics via confusion matrix + ROC curves.
4.2 Baselines vs. final model
- Trivial: always 0 (high accuracy, F1≈0); always 1 (recall=1, terrible precision/accuracy).
- Course-style logistics: price-only (
return, log_volume); WSB numeric-only (mention_count, score_sum); price + WSB numeric (small lift); TF-IDF text-only (big recall/ROC gain); TF-IDF text + basic numeric (best untuned). - Final model: TF-IDF + all numeric (price lags, volatility, volume anomaly, WSB numeric, sentiment), tuned by
GridSearchCV(TimeSeriesSplit, scoring=F1). Best F1 and ROC-AUC on test with similar accuracy to simpler baselines.
All results summarized in a test metrics table with columns model, accuracy, auc, recall, f1, precision, sorted by F1.
4.3 Plots & main conclusions
- Confusion matrix (final model): built from
y_test_gridvs.(y_prob_test_best ≥ τ)(F1-tuned τ); shows more true positives than false positives while keeping many true negatives. - ROC: price-only vs. final: final curve dominates price-only over most FPR, confirming better ranking of “hot” ticker-days.
Takeaway: Final text+numeric model leads on F1/ROC while keeping accuracy similar to simpler baselines; text-only already provides a big lift over numeric-only features.
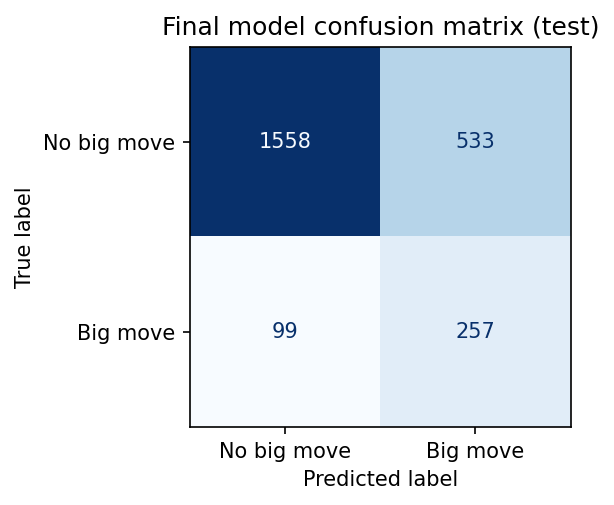
Takeaway: More true positives than false positives while keeping many true negatives, consistent with a threshold tuned for F1 on an imbalanced label.
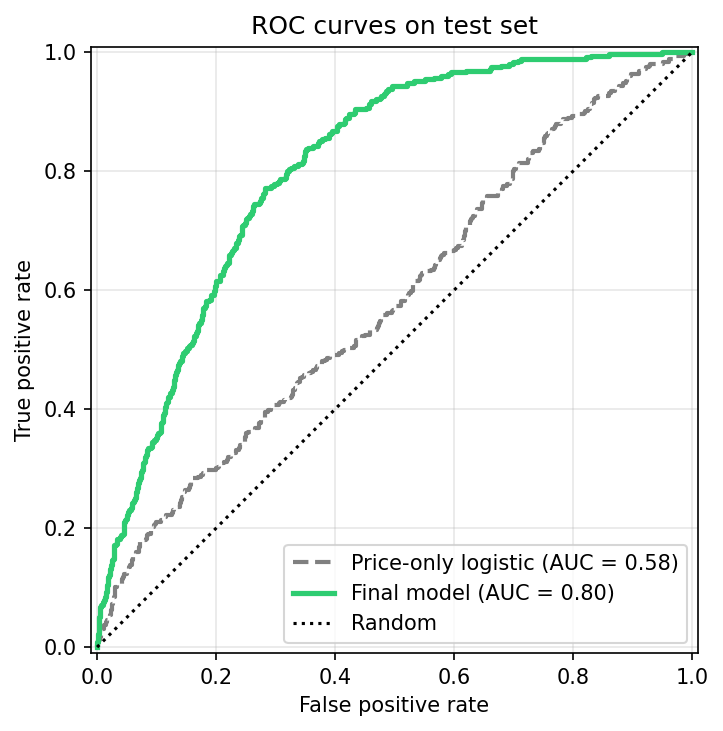
Takeaway: The tuned text+numeric model dominates the price-only baseline across operating points, showing better ranking of hot tickers.